Bay Watch: A Weekly Look into the Bay Area Economy
September 10th, 2024
Is the Bay Area gaining population or losing population? Well, it depends on who you ask.
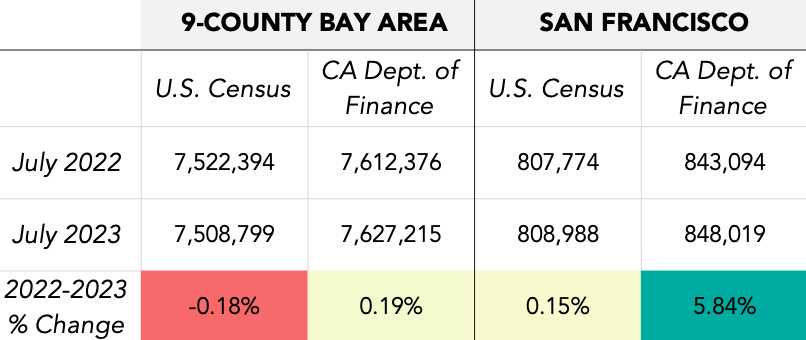
Accurately estimating a region’s population is more complicated than it may seem, and is approached in different ways by federal and state government bureaus. Two such bureaus, the U.S. Census’ Population Estimates Program (PEP) and the California Department of Finance (DOF), released their estimates for 2023 earlier this year for statewide and county-level populations, but the figures differed widely.
The Census PEP, a trusted source for population, migration and demographic data, estimated a 2% year-over-year decrease in the region’s total population, while the CA DOF, which releases annual population estimates for county and sub-county geographies, saw a 2% increase. The DOF also estimated that San Francisco’s population grew at a faster rate than what was reported by the Census Bureau.
These vast differences beg the question, which source more accurately reflects the region’s growth? This week’s Bay Watch analysis explores some of the key differences in methodology and reporting, and why you may hear contradicting stories about our regional population trends.
How do the data compare historically?
For much of the last decade, the Census PEP and DOF data have paralleled one another. However, since the 2020 Decennial Census, estimates have diverged. 2021 saw the largest gap in the two sources, while both estimates followed more similar change pattern in 2022. The pandemic disrupted the Census Bureau’s efforts to achieve an accurate population count, particularly in transient communities such as college towns, where populations were recorded as lower than their typical de jure numbers. Studies estimate that the Census at-large undercounted the U.S. population by 782,000. As for 2023, the Census receives IRS data in October, so it is possible that the extension of IRS tax return due date to 11/16/2023 for Californians caused some undercount of the state’s in-migration. This October, the Census Bureau is set to receive comprehensive IRS data for the 2024 estimates. Should the gap narrow, it would point more definitively to the extended tax return deadline as the likely cause.
While necessary for consistency across regions, the Census Bureau takes a more standardized approach to estimating populations. Before the pandemic, this approach yielded nearly identical results to the CA DOF, but since the 2020 undercount, this approach has failed to capture nuances of post-pandemic migration and population change that the DOF more accurately computes through more localized data and computational methods. The next section delves into these methodological differences.
How do the methods differ?
The Population Estimates Program (PEP) produces estimates of national, state, county, and sub-county populations on an annual basis. County-level population estimates are determined by something called the Cohort-Component Method, where the decennially determined population base (in this case the 2020 Decennial Census) is benchmarked and adjusted through a population change estimation using recorded births, deaths, and net migration. Net migration is largely measured through IRS tax data, though Medicare enrollment data are also used to assess net migration for individuals over 65 as they are more likely to enroll in Medicare than file taxes. Other sources include Social Security Numerical Identification files, and the change in group quarters (dorms, nursing homes, etc.) population.
The California Department of Finance (DOF) offers a more nuanced approach to population estimation by producing both county and state-level numbers that leverage local data sources to capture the unique demographic dynamics of California. Unlike the Census Bureau’s more generalized methods, DOF estimates for counties are derived from an average of three distinct methods:
1) the Driver’s License Address Change (DLAC) method (the only method used for state totals) employs data from the DMV, and integrates changes in births, deaths, school enrollment, foreign and domestic migration, medical care and medical aid enrollments, and group quarters population;
2) the Ratio-Correlation Method estimates the change in household population as a function of changes in the distributions of driver licenses, school enrollments, and housing units, and finally
3) the Tax Return Method federal income tax returns estimate inter-county migration along with vital statistics, group quarters, and other information for the population aged 65 and over.
So, what source should I use?
When it comes to accurately estimating population data for California, the California Department of Finance (DOF) is a more reliable source than the Census Bureau’s Population Estimates Program (PEP). One key reason is that the Census Bureau is bound by a one-size-fits-all methodology that applies uniformly across the entire country, limiting its ability to account for unique regional factors. By contrast, the DOF’s demographers have access to the same federal data as the Census, but also state-specific data sources -- such as driver's license changes, state tax filings, school enrollment, and other records, which allow for more precise and timely estimates. Because the DOF can track changes to these real-time indicators, they can more accurately predict early signs of population growth or decline.
However, the Census Bureau’s PEP data should be used when comparing population data across state lines. Its standardized methodology ensures that estimates are consistent and comparable on a national scale, providing a uniform basis for evaluating demographic trends between different states or counties within those states. This analogous approach is useful for broad cross-state comparisons, despite limitations in capturing regional nuances.
